When trellising charts, the Trellis Axes function can be used to show or hide trellis labels for each chart, and edit the font for trellis labels. Changes made to the trellis axes can be applied to the x- and/ or y-axis as required.
In this example, we see the charts trellised vertically and the trellis axis labels on the y-axis: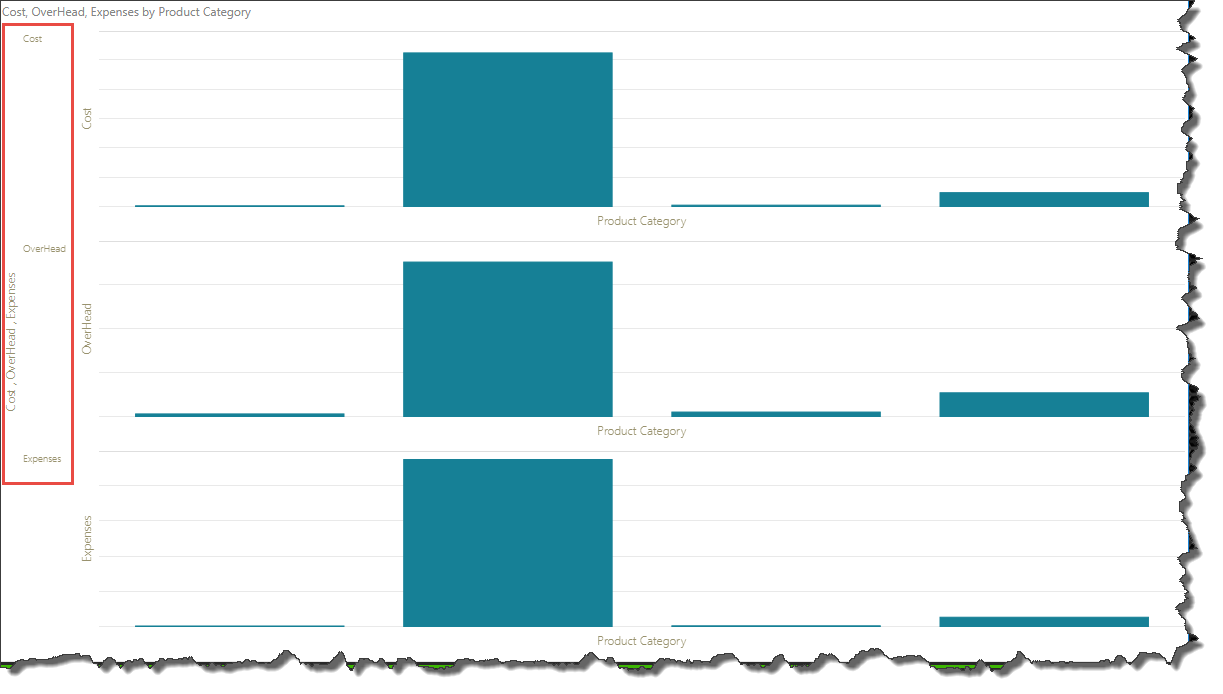
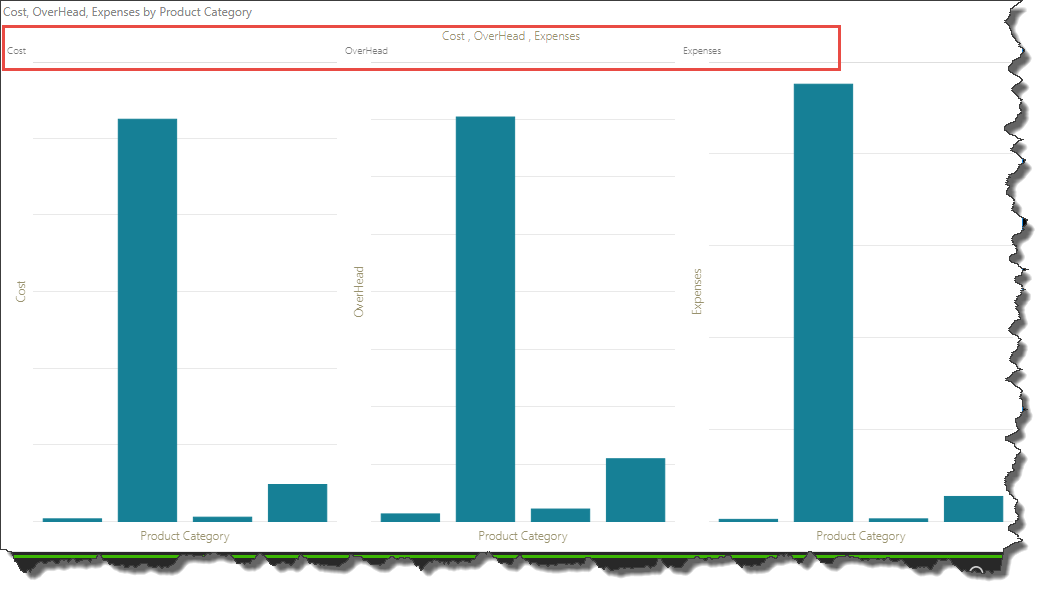
Here, the charts are trellised horizontally and the trellis axes labels are on the x-axis:
Formatting for Trellis Axes
To adjust formatting for the x-trellis axis or the y-trellis axis, open the Formatting panel and choose either X-Trellis Axis or Y-Trellis Axis from the top drop-down list.
Alternatively, enable the formatting selection tool and click select the relevant trellis axis on the canvas. Both the x- and y-trellis axis options feature the following 4 tabs:
Axis Labels
Adjust the font for the chosen trellis axis:

- Font: change the font type.
- Size: change the font size.
- Style: change the font style (bold, italics, or color).
- Align: align the trellis axis label to the top, middle, or bottom of the trellis axis.
Title
Adjust the trellis axis title:

- Show Axis Title: show or hide the title for the trellis axis.
- Title: use the Auto title (titled according to the hierarchy or measure on the axis) or choose Custom to change the axis title.
- Font: change the font type.
- Size: change the font size.
- Style: change the font style (bold, italics, or color).
Axis Lines
Show and adjust a trellis axis line:

- Show Axis Line: toggle to show or hide the trellis axis line.
- Color: change the color of the trellis axis line.
- Thickness: change the thickness of the trellis axis line.
- Line Style: choose a solid, dashed, or dotted line.
Settings
Chart Padding: increase tor decrease the padding between charts along the given axis.
